The Ethics of Data Visualization
Data visualization plays a crucial role in how we interpret complex information, but aesthetics can sometimes obscure truth. Beautiful visuals can mislead by emphasizing certain data points while neglecting others, leading to skewed perceptions. Understanding the ethical implications of design choices is essential for responsible communication of data. Examining the balance between engaging visuals and accurate representation reveals the potential for both insight and deception.
- ReadData and information visualization · Wikipedia
Defines data visualization as the creation of graphic representations of data to help audiences quickly understand complex information and discover patterns.
- ReadHow not to be fooled by viral charts · Noahpinion (Substack)
Identifies characteristics of viral charts that can mislead audiences, including intentional deception and careless mistakes, while providing tools to critically assess data visualizations.
- WatchHow to spot a misleading graph - Lea Gaslowitz · YouTube
Explains how graphs can manipulate perceptions through design choices, highlighting common pitfalls and offering strategies for discerning misleading visuals.
- BookThe Visual Display of Quantitative Information · Bookshop.org
Analyzes the principles of effective data graphics, emphasizing the importance of clarity, precision, and ethical design to avoid graphical deception.
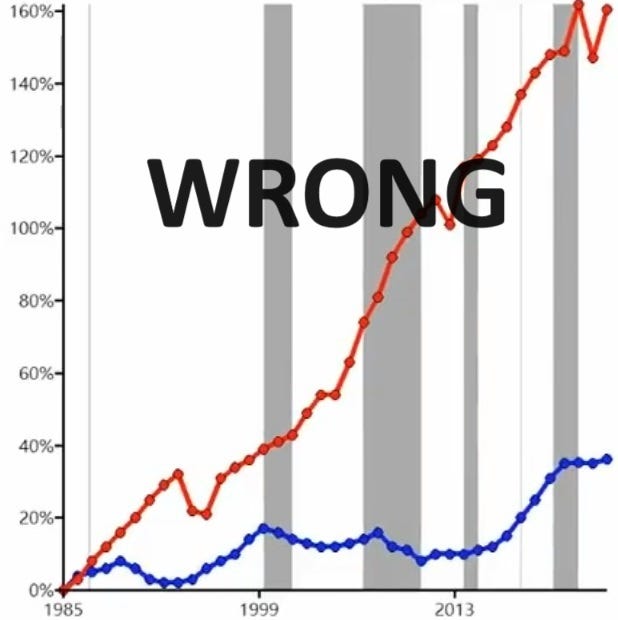

The selected pieces collectively illustrate the complexities and ethical considerations of data visualization. Starting with foundational definitions, the curation progresses through practical guidance on identifying misleading graphs, culminating in a classic text that delves into the theory and practice of effective data representation. Together, they provide a comprehensive understanding of how visuals can both inform and deceive.
Book links are Bookshop.org affiliate links. Curiate may earn a commission on purchases, at no extra cost to you — Bookshop.org also gives a share to independent bookshops.
Reading paths, built to arrive somewhere
Curiate turns what you are curious about into a short path — an entry point, something to watch, and the key book on the topic. Free to browse.