How economic indicators and sentiment diverged after the pandemic
Economic indicators are statistics about economic activity that help people assess how the economy is doing and predict how it may perform in the future. How can economic measures and people's feelings about the economy tell different stories, and what can that difference help us understand? The lessons consider how measured economic conditions and lived sentiment relate, and why their relationship matters.
2 articles, 1 video, 1 book · about 20 min of reading and viewing
The reading path
- Readeconomic indicators · Wikipedia · 7 min read
Coincident indicators change at approximately the same time as the whole economy, providing information about its current state. A coincident index may be used to identify, after the fact, the dates of peaks and troughs in the business cycle. Local governments often need to project future tax revenues. San Francisco uses the price of a one-bedroom apartment on Craigslist, weekend subway ridership numbers, parking garage usage, and monthly reports on passenger landings at the city's airport as economic indicators.
- ReadComplacency in the U.S. Economy - A Wealth of Common Sense · A Wealth of Common Sense · 5 min read
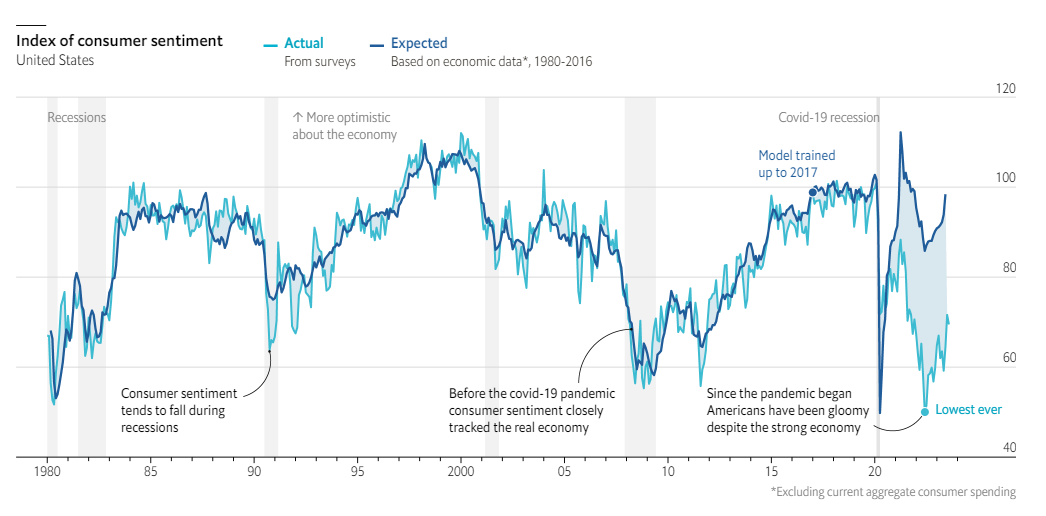
Economic data and how people feel are in a weird place: objectively, the U.S. economy has been strong for some time, though things could get worse any day now.
- WatchLimitations of GDP | Economic indicators and the business cycle | AP Macroeconomics | Khan Academy · YouTube · 8 min watch
GDP is the most commonly used measure of output, but it leaves some things out.
- BookFreakonomics: A Rogue Economist Explores the Hidden Side of Everything · Bookshop.org
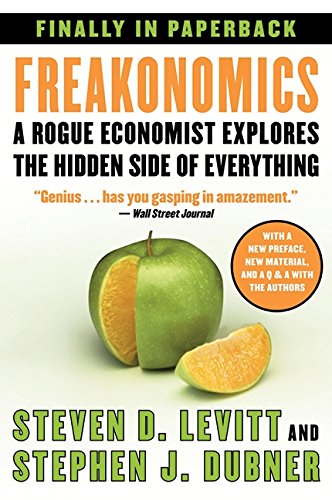
Freakonomics by Steven D. Levitt and Stephen J. Dubner argues that economics is, at its roots, the study of incentives, and describes using data mining and detailed analysis of students' answers to infer teacher cheating.
Book links are Bookshop.org affiliate links. Curiate may earn a commission on purchases, at no extra cost to you — Bookshop.org also gives a share to independent bookshops.
Reading paths, built to arrive somewhere
Curiate turns what you are curious about into a short path — a quick lesson on an article, something to watch, and a book to go deep on. Free to browse.